Residents in southern Allegheny County likely woke up to bittersweet news on March 10. The temperature was set to reach highs not seen in the region since early November, but the air quality was also reaching potentially unhealthy levels.
Late winter and early spring sometimes bring days like this to Allegheny County. Temperature inversions mean the air on the ground is quite warm, but cold air masses above it in the atmosphere trap pollutants that near the surface. This becomes evident when air quality warnings are announced, and bad smells are tracked through tools like the SmellPGH app.
But what hasn’t been as obvious to the average Pittsburgher is exactly where these pollutants are coming from and how they spread across the region.
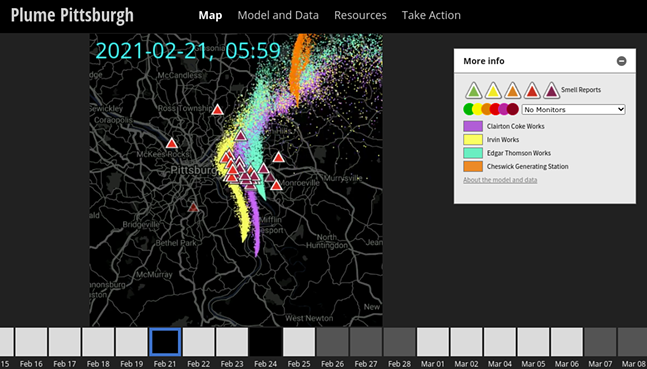
Now, a new website from Carnegie Mellon University’s CREATE Labs is hoping to show the visualization of that air pollution.
PlumePGH uses detailed weather models from the National Oceanic and Atmospheric Administration (NOAA) to track how emissions spread across Pittsburgh, and visualizes how sulfur emissions from the county’s four biggest sulfur emitters — U.S. Steel's Clairton Coke Works, Irvin Works and Edgar Thomson Works, and the Cheswick Generating Station.
According to a post on CMU’s website, moving dots on PlumePGH’s map represent the plumes being tracked, while different colors denote the four different pollution sources. The dots represent air particles and their movement is modeled after NOAA weather models for each day. The denser the dots, the more it means the emissions are staying close to the surface, and the less dense means the emissions are clearing quickly higher into the atmosphere.
The map shows that even though the four big emitters are located at the edges of Allegheny County, the sulfur emissions still regularly travel miles into the center of Pittsburgh.
"The alignment of these independent data sources can help us understand whose health may be impacted by this industrial pollution," said Randy Sargent of CREATE Lab in the online post. "The PlumePGH website lets you explore across time and find how pollution moved on any given day. You can explore smell reports and modeled pollution and add a variety of air quality monitoring data to the map as you engage in this effort to hold these industries accountable."
Advocacy from groups like Breathe Project and Group Against Smog and Pollution have been calling on the Allegheny County Health Department to increase fines against industrial companies that violate the county’s air quality standards, as a way to decrease the number of days that unhealthy levels of pollution are emitted into the region. These emissions are exacerbated on days when temperatures inversions hit the greater Pittsburgh area. Inversions occur about 157 days a year on average, according to the health department.
Recently, Allegheny County reached an air quality milestone when it saw its first-ever days in compliance with all federal air quality guidelines, but environmental advocates worry those victories could be short lived.
Ana Hoffman of the CREATE Lab also hopes that PlumePGH website will provide Pittsburghers more information and transparency about the sources of emissions and smells that might be affecting their health.
"It helps a person feel connected to other people who are experiencing pollution," Hoffman said on CMU’s post. "We want this to be a technical resource — much like SmellPGH and the Breathe Cams — where someone experiencing a pollution event can go to add data to back up their concern."


