Friday, May 15, 2015
CMU and Breathe Project present interactive air quality maps for Allegheny County

Photo courtesy of Carnegie Mellon University CREATE Lab
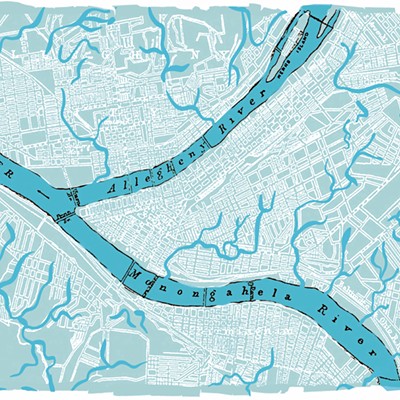
You can now type your home address into an interactive map and learn about air quality in your neighborhood, all thanks to new maps published on the Heinz Endowments' Breathe Project website.
Carnegie Mellon University's Center for Atmospheric Particle Studies produced the maps, which are a culmination of four years worth of real-time air quality data. Researchers drove a mobile lab to approximately 70 distinct locations during different times of the day and year, and they eventually gathered enough data to create estimates of annual averages of seven types of air pollutants.
"What we really want to be able to do is say where it's [the pollution] coming from," says Albert Presto, of CMU's Center for Atmospheric Particle Studies, who headed the project. "Our other goal was looking for hot spots."
Presto and his colleagues found hot spots around Downtown, and the three centers of industry in Allegheny County - Cheswick, the Mon Valley, and Neville Island. Another hot spot was Carnegie.
"That's one we didn't necessarily expect because when you think about the big industrial sources, none of them are there," Presto says. "It turns out, there's sort of a collection of smaller sources there, and there is a valley. Those things conspire to lead to higher concentrations [of pollutants]. We do predict elevated concentrations in that part of the valley."
The researchers collected data on seven pollutants - nitrogen oxides, sulfur oxides, ozone, hydrocarbons, fine particulate matter, including black carbon particles, and carbon dioxide, some of which are considered "criteria pollutants" by the Environmental Protection Agency, meaning that the EPA sets standards for them under the Clean Air Act.
The EPA warns that pollutants like ground-level ozone, particulate matter, and nitrogen dioxide can irritate the lungs, induce asthma symptoms and/or cause premature death.
The current interactive maps on the Breathe Project's website only allow people to find averages for black carbon and nitrogen dioxides.
"The plan is to add more pollutants as the maps become available," Presto says. "But this at least gives us a start and people can start looking at it."
The maps garnered some attention over the winter when Presto introduced them to the public, but now people can actually interact with them and take a closer look at their neighborhoods.
Presto says mapping the pollutants is only step one.
"One of the next steps is to help translate that to risk. You can look at the map we have now and see higher concentrations in some places than others, but then there's the question, 'how much does that impact your health?'" Presto says. "The other goal is to think about sources. What we want to do is build maps that are source-based. Ultimately when you think about policy, if you want to reduce concentrations of particular pollutants, what you need to do is regulate sources."
Tags: air pollution , ozone , nitrogen dioxide , sulfur oxides , particulate matter , EPA , CMU , Carnegie Mellon University , Albert Presto , maps , Image